Why do interventions fail?
Standard evaluations of digital technology interventions track adoption rates and near-term productivity gains. This project argues that those metrics are structurally blind to slower-moving harms — harms that accumulate in dimensions those metrics were never designed to reach.
This project builds an agent-based model of how small-scale fishers decide whether to adopt a digital advisory application — and how that decision ripples outward through the community over time. The first completed study introduces the application in season one and runs 10 trials of 100 seasons across three network topologies and a no-intervention control.
Each simulated fisher is shaped by trust, perceived risk, alternative information access, social network position, fishing skill, and resource constraints. The environment fluctuates seasonally and is subject to stochastic shocks calibrated to West African fisheries data. The social network — clustered, hub-and-spoke, or dispersed — determines how adoption pressure flows through the community.
The central finding is that a technically sound intervention can produce measurable short-run productivity gains while simultaneously generating two forms of longer-run harm: depletion of a shared fish stock and erosion of traditional ecological knowledge among fishers who never used the app at all.
Two harm channels,
neither visible to standard monitoring
Across all three network topologies and 10 independent trials of 100 seasons, the model produced adoption gains that look healthy by conventional metrics alongside two slower-moving harms that those metrics cannot see.
Human Capital Erosion
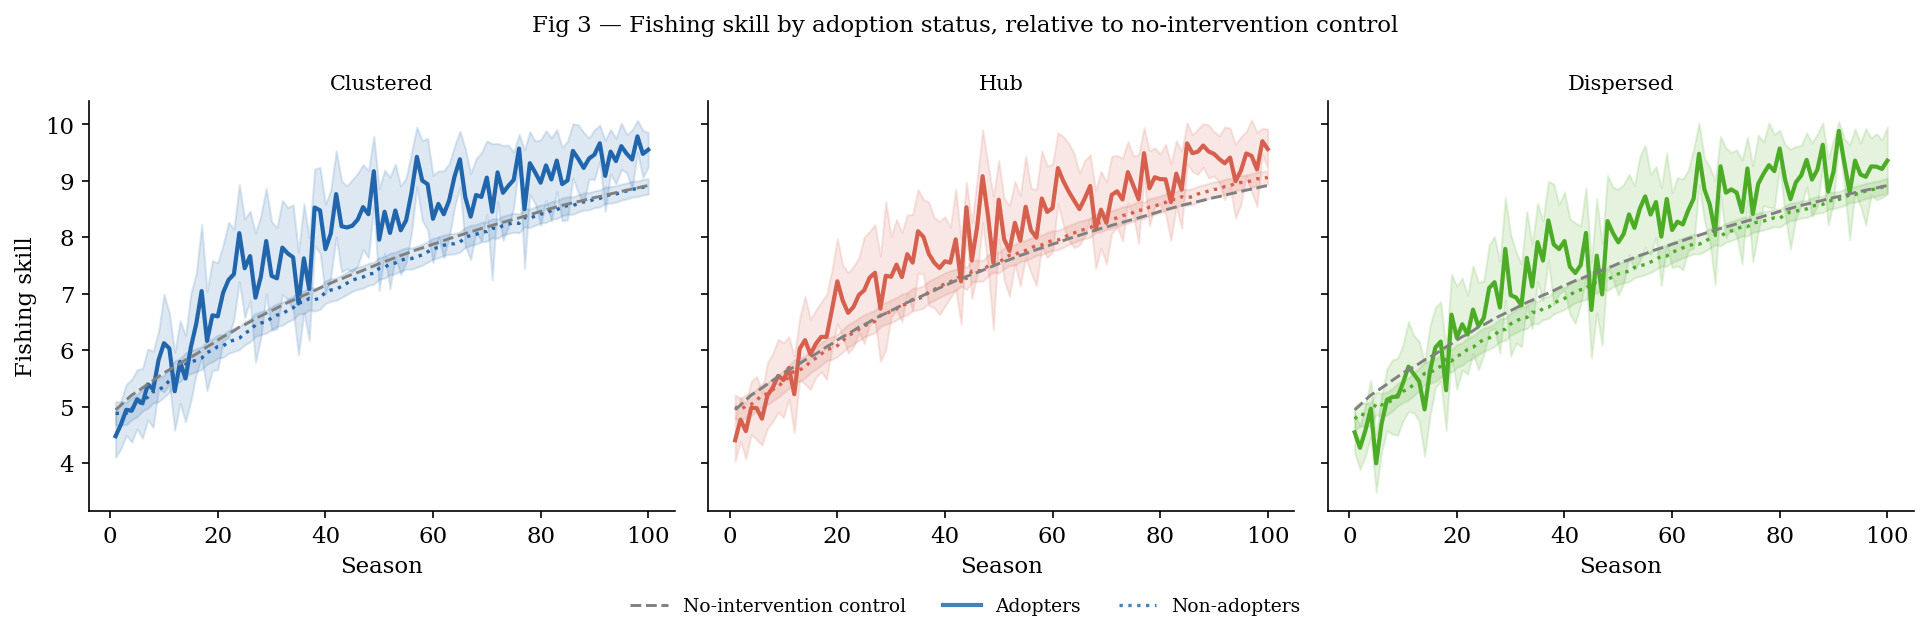
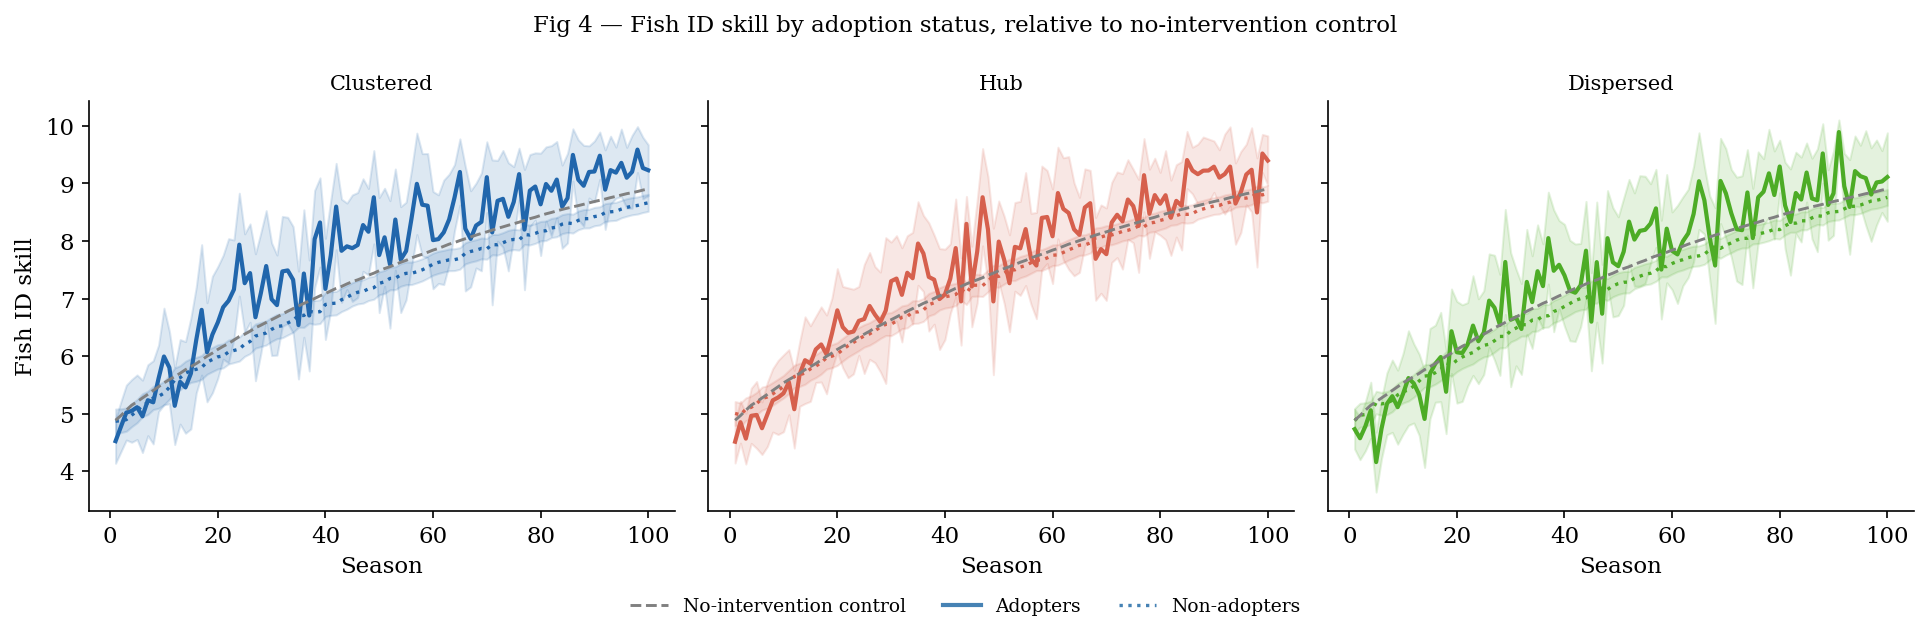
Non-adopters — fishers who never used the application — fell systematically below the no-intervention counterfactual on fish identification skill across all topologies. The gap grew monotonically over 100 seasons. Two mechanisms drove it: adopters claimed larger catch shares, reducing the experience that builds non-adopter skill; and adoption at even low rates shifted community norms in ways that depreciated investment in traditional knowledge. Non-adopters were not harmed by their own inaction. They were harmed by a shift in the competitive and social environment they did not choose.
Ecological Depletion
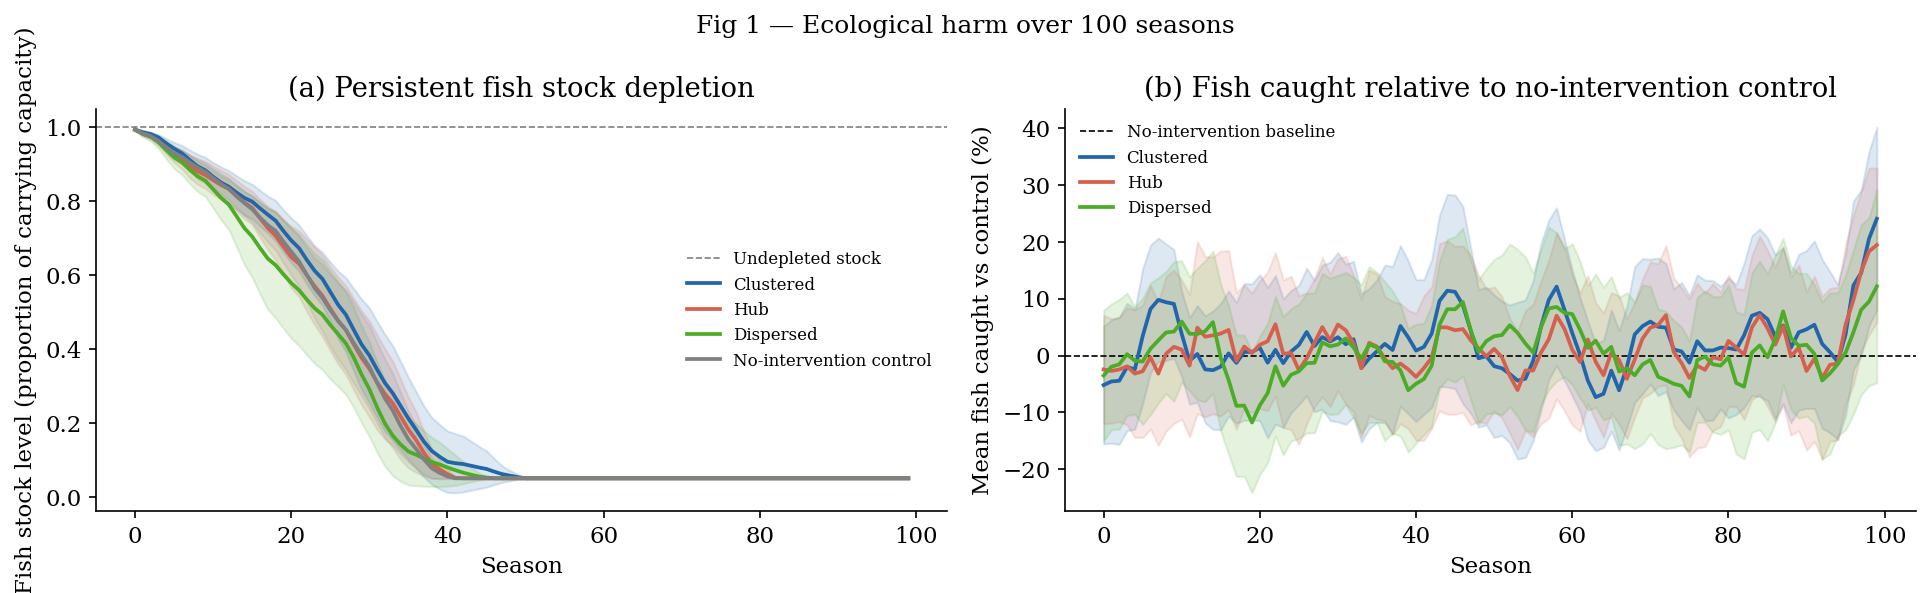
All conditions deplete the shared fish stock toward a floor by roughly season 50, reflecting the background overharvest pressure inherent to 50 agents sharing a common pool. The intervention's ecological contribution is therefore most visible in the rate of early depletion rather than the eventual endpoint. The dispersed topology showed the clearest differential, falling 0.028–0.094 stock points below control at seasons 10–20 — consistent with dispersed networks lacking the repeated peer interactions that would otherwise dampen competitive fishing pressure. Wide confidence intervals across all conditions mean the harm is undetectable by aggregate catch monitoring even after 100 seasons.
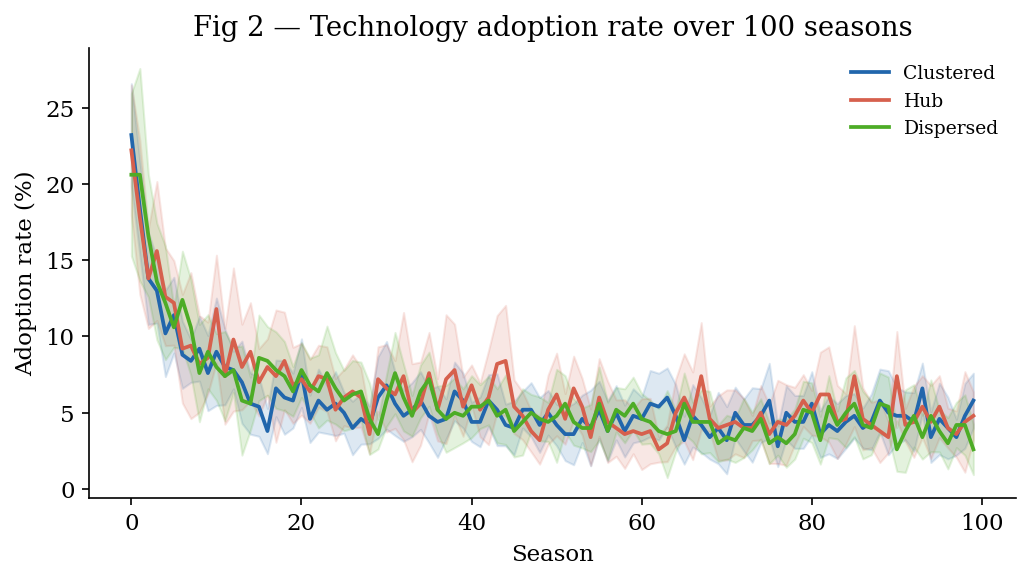
Dispersed topology in first two seasons — before collapsing to a long-run equilibrium of 4–5% as early harm to low-mastery adopters eroded trust irreversibly.
Clustered non-adopters below the no-intervention baseline by seasons 80–100. Hub topology: 0.08 pts. Dispersed: 0.25 pts. All gaps grew continuously.
Maximum stock depletion gap between dispersed topology and control at seasons 10–20. Clustered topology initially tracked above control, as clique structure slowed diffusion of adoption-driven fishing pressure.
Topology shapes the distribution of harm, not whether it occurs
| Topology | Long-run adoption | Fish ID skill gap (adopter vs non-adopter) |
Non-adopter deficit vs control | Ecological signal |
|---|---|---|---|---|
| Clustered Tight cliques, weak inter-group ties |
4.6% | 0.70 pts | −0.27 pts | Initially tracks above control; clique structure slows early diffusion of fishing pressure |
| Hub 3 brokers, peripheral agents |
4.9% | 0.43 pts | −0.08 pts | Falls slightly below control from season 18; brokers attenuate skill divergence by distributing adoption more evenly |
| Dispersed Erdős–Rényi, mean degree ≈ 5 |
4.2% | 0.43 pts | −0.25 pts | Clearest early depletion differential (−0.028 to −0.094 stock pts at seasons 10–20); no coordination norms to dampen competitive pressure |
Adoption rates and aggregate productivity stay within plausible ranges in every condition throughout all 100 seasons.
The harms accumulate in a non-adopter counterfactual comparison and in a stock trajectory that standard evaluation designs do not track. An evaluator monitoring only adoption rates and mean catch would observe nothing anomalous and conclude the program is working. That conclusion would not be wrong given the data collected. It would be wrong given the data not collected. Closing the gap requires longer measurement windows, explicit tracking of non-adopter trajectories, a no-intervention counterfactual, and traditional knowledge indicators alongside productivity metrics.
A seasonal, networked world of
boundedly rational fishers
The model is built in Python using the Mesa agent-based modeling framework. It consists of five interacting components.
Fisher Agents
Each agent holds 11 attributes including trust, perceived risk, perceived usefulness, resource level, time horizon, tech literacy, fishing skill, and social network position. Attributes are updated each season based on outcomes and peer observation.
Seasonal Fish Population
Three seasons model a West African fishing calendar: cool-dry (peak, May–Aug), hot-dry (moderate, Sep–Dec), and rainy (low, Jan–Apr). Dry-season catch runs approximately 6× rainy-season catch. Shock probabilities are 0.05, 0.10, and 0.20 respectively. A persistent stock recovers logistically each season but depletes under overharvest.
Three Network Topologies
Clustered (tight village cliques with weak inter-group ties), hub-and-spoke (community leaders bridging sparse connections), and dispersed (random Erdős–Rényi). Network topology is a primary experimental variable.
Technology Intervention
The intervention improves outcomes through two pathways: skill augmentation (multiplier on fishing effectiveness) and information improvement (variance reduction in catch outcomes). A learning curve governs how quickly agents realize the intervention's full benefit.
Adoption & Dropout
Agents adopt based on a logistic function over trust, perceived usefulness, social influence, and risk. Dropout is tracked separately from never-adoption — the two have different behavioral signatures and different policy implications.
Seasonal Time Series
Each run produces adoption rates, trust distributions, catch outcomes, and overfishing indicators across seasons and years. Summary statistics across trials include means, medians, standard deviations, and 95% confidence intervals.